Connectivity
Graphics Chips Help Process Big Data Sets in Milliseconds
A new database tool dramatically improves processing speeds using technology that’s already in your computer.
New software can use the graphics processors found on everyday computers to process torrents of data more quickly than is normally possible, opening up new ways to visually explore everything from Twitter posts to political donations.
Known as MapD, or massively parallel database, the new technology achieves big speed gains by storing the data in the onboard memory of graphics processing units (GPUs) instead of in central processing units (CPUs), as is conventional. Using a single high-performance GPU card can make data processing up to 70 times faster.
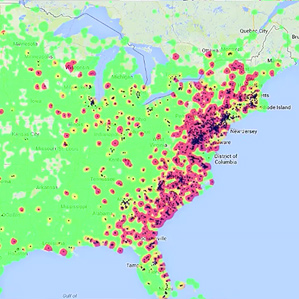
Right now the prototype technology is being demonstrated on tweets; it can show how a meme is propagating in real time on regional or world maps (watch “Visualizing Big Data in Milliseconds on Cheap Computers”). Many large-scale Twitter visualizations—including animated maps and charts—take several seconds or longer to process data before it can be displayed. With MapD, a user can adjust search terms and other parameters—like time frame or geographical region—and see a new visualization instantly, without having to wait for each new map and animation to compute and load.
This public interface can be used to visualize 50 million geocoded tweets posted between September 28 and October 6. The tool allows users to explore different search terms, examine broad geographical trends, and zoom in on each tweet. For each of the 30 frames per second it generates when animating Twitter, Map-D scans all the tweets that have been loaded on the GPUs, constructing visualizations such as maps of how word usage—which could include mentions of a product name or news item—is propagating across a region or around the world in real time.
“The [existing Twitter visualizations] we know of are ‘canned’—based on some previous computation of a map or picture, rather than being truly interactive,” says Samuel Madden, a computer science professor at MIT. “We have built a new kind of database system. It will answer and also map every request by scanning through every tweet in the database, which can be done in just a few milliseconds.” The system can keep up the pace even if the database has hundreds of millions of tweets.
The technology was dreamed up last year by Todd Mostak, then a Harvard graduate student in Middle Eastern studies, who was frustrated by the sluggish processing he encountered as he tried to crunch social-media data sets from Egypt and elsewhere in the Middle East. “By building a tool to explore data sets like this in a truly interactive fashion, with latencies measured in milliseconds rather than seconds or minutes, we hope to remove a computational bottleneck from the process of hypothesis formulation, testing, and refinement,” Mostak says.
The technology could make it easier to glean insights from Twitter’s huge corpus of information. Combining census data with tweets, for example, could show how mention of the word “McDonald’s” in geotagged tweets relates to variables like income or unemployment levels.
An early adopter will be the Sunlight Foundation, which promotes openness in campaign financing. That organization is feeding 22 years of U.S. state and federal campaign donation data to MapD, which will provide ways to rapidly vary visualizations that break down more than 20 million donations according to donor, region, elected official, and other parameters. Each new type of query will generate a new visualization in just milliseconds.
Using existing methods, it can take seconds for a visualization to load, because it takes that long to query the information in a database. Faster access enables researchers to test hypotheses and refine visualizations more quickly. That could make big data sets more useful. “Many laptops even contain fairly powerful GPUs—fast enough to dramatically accelerate the interactive exploration of moderate-sized data sets of, say, 20 million tweets,” Mostak says.
“MapD’s technology promises to make new kinds of real-time queries possible,” says Bob Lannon, a developer at Sunlight Labs, which develops data analysis tools for the Sunlight Foundation. “Soon you will be able to quickly explore large amounts of data and pivot, filter, and summarize it in ways not previously available. We’re excited to see what it could mean for our users.”
Nvidia, one of the leading manufacturers of GPUs, plans to demonstrate MapD on more than one billion tweets using eight GPUs at an upcoming conference. The researchers are also planning to do a joint demo with Gnip, the leading reseller of social-media data from sources like Twitter, Foursquare, and Facebook. Elaine Ellis, a spokeswoman for Gnip, said the company was not ready to talk about the collaboration.
Twitter reported recently that it has 215 million monthly active users broadcasting more than 400 million tweets per day. Of these, about seven million tweets contain GPS geolocation tags, typically from mobile devices. Being able to visualize massive streams of geographically identifiable social-media and mobile-phone data in real time could have powerful implications for epidemiology and disaster response (see “Big Data from Cheap Phones”).
Beyond using graphics chips, Madden and Mostak are working with researchers from Intel to allow MapD to take advantage of the company’s new massively parallel processors as well as the ordinary X86 processors that power most computers.
