
Sustainable Energy
Small Gains
Wind and solar power are ramping up quickly, but the world’s demand for electricity is growing much faster.

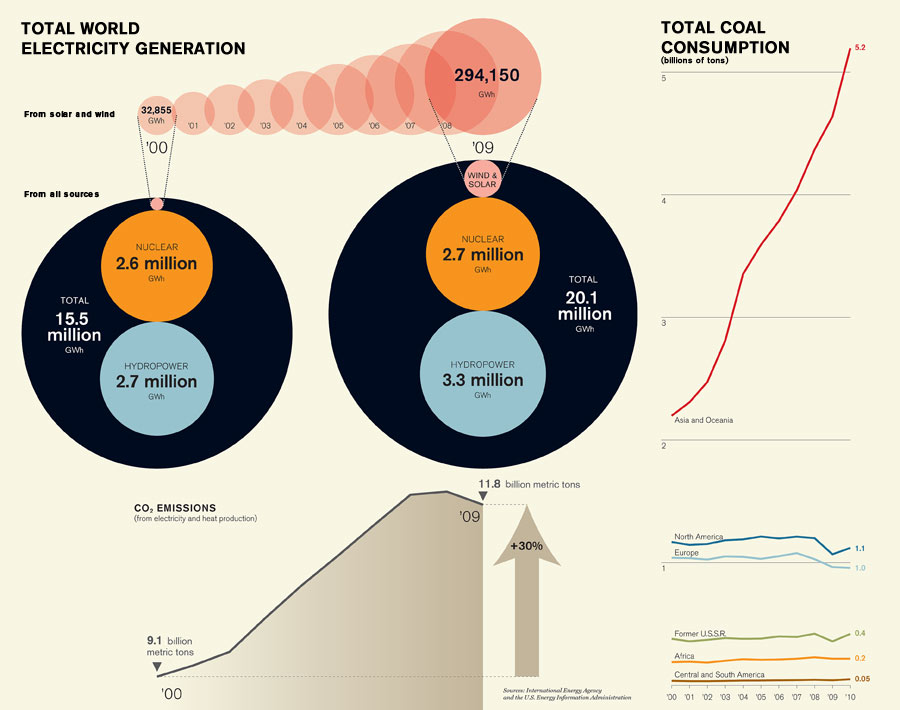
The use of wind and solar power ballooned almost ninefold from 2000 to 2009, the most recent year for which the International Energy Agency has made data available. But that hasn’t really shifted the overall mix of the world’s electricity supply.
That’s because worldwide demand for power is growing on a different scale. From 2000 to 2009, as the annual generation from wind and solar rose by about 260,000 gigawatt-hours (GWh), total generation increased by nearly 4.7 million GWh.
As a result, carbon dioxide emissions from electricity production, which represent roughly 40 percent of the world’s energy-related emissions, keep rising. The figure leveled off in 2008 and shrank in 2009 because of the global recession, but an international group of climate scientists recently reported that total fossil-fuel-related emissions grew by 5.9 percent in 2010, the largest annual increase ever recorded. Over half of that growth came from increased combustion of coal, which has held steady as the source of about 40 percent of the world’s electricity. Much of the new demand is coming from Asia.
In these charts, we show how the world’s sources of electricity changed—and didn’t change—in the previous decade. The message: solar and wind have a long way to go.
Advertisement